Source: Glen Peters, CICERO. (Excel spreadsheet.)
Energy exports in petajoule
|
|
Coal
|
Crude oil
|
Petroleum products
|
Natural gas and other gases
|
Total
|
|
2004
|
77,0
|
5261,4
|
785,9
|
3061,0
|
9185,3
|
|
2005
|
46,8
|
4818,8
|
820,1
|
3313,4
|
8999,1
|
|
2006
|
63,7
|
4231,5
|
901,2
|
3372,3
|
8568,7
|
|
2007
|
94,7
|
4115,0
|
785,1
|
3406,1
|
8400,9
|
|
2008
|
93,5
|
3732,1
|
880,8
|
3822,1
|
8528,5
|
|
2009
|
67,3
|
3634,0
|
799,9
|
3566,6
|
8067,8
|
|
2010
|
46,3
|
3223,2
|
709,9
|
3656,4
|
7635,8
|
|
2011
|
32,5
|
2893,6
|
743,8
|
3508,5
|
7178,4
|
Conversion factors
|
|
Coal
|
Crude oil
|
Petroleum products
|
Natural gas and other gases
|
|
t CO2/t
|
2,52
|
3,17
|
3,17
|
2,34
|
|
GJ/t
|
28,1
|
42,3
|
43,1
|
40
|
|
t CO2/GJ
|
0,089679715
|
0,074941
|
0,07354988
|
0,0585
|
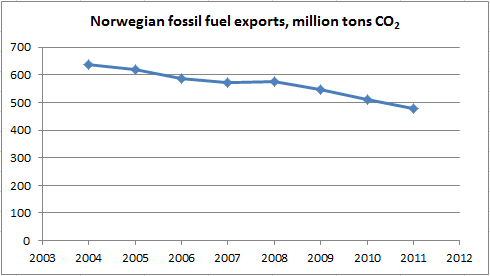
Energy exports in million tons CO2
|
|
Coal
|
Crude oil
|
Petroleum products
|
Natural gas and other gases
|
Total
|
|
2004
|
7
|
394
|
58
|
179
|
638
|
|
2005
|
4
|
361
|
60
|
194
|
619
|
|
2006
|
6
|
317
|
66
|
197
|
586
|
|
2007
|
8
|
308
|
58
|
199
|
574
|
|
2008
|
8
|
280
|
65
|
224
|
576
|
|
2009
|
6
|
272
|
59
|
209
|
546
|
|
2010
|
4
|
242
|
52
|
214
|
512
|
|
2011
|
3
|
217
|
55
|
205
|
480
|